


Are you getting out of memory errors? Or finding other memory related error messages in the SQL Server errorlog? Are you troubleshooting an issue on an SQL Server that you are not familiar with – and want to get a quick overview of how much RAM the server has, how much is allocated to SQL Server etc?
Then hopefully you’ll find the below script very handy. It uses some of the SQL Server system DMVs to provide a quick overview of the current memory configuration and utilisation.
The output includes the below details:
- Total RAM on your SQL Server host in GB
- Available free RAM on your SQL Server in GB
- A rating of the current memory availability, as SQL Server sees it
- Values of “min server memory (MB)” and “max server memory (MB)” set via sp_configure
- Current buffer pool size in GB
- Current procedure cache size in GB
I use this script all the time when trying to get a quick overview of the current memory situation of my SQL Servers.
This query uses the following SQL Server system Dynamic Management Views (DMV):
- sys.dm_os_sys_memory
- sys.configurations
- sys.dm_os_buffer_descriptors
- sys.dm_exec_cached_plans
See also: How to calculate the ideal value for ‘max server memory (MB)’ server parameter?
Here’s the query:
SET NOCOUNT ON

--Created by Vyas Kondreddi
--https://dutydba.com/

DECLARE @Memory table
(
    MemID int IDENTITY,
    MemItem varchar(64),
    MemValue sql_variant
);

WITH MemCTE AS
(
    SELECT
        (total_physical_memory_kb/1024/1024) AS TotalRAM_GB,
        (available_physical_memory_kb/1024/1024) AS AvailableRAM_GB,
        system_memory_state_desc
    FROM
        sys.dm_os_sys_memory
)
INSERT INTO @Memory (MemItem, MemValue)
SELECT 'Total RAM (GB)', TotalRAM_GB
FROM MemCTE
UNION ALL
SELECT 'Available Free RAM (GB)', AvailableRAM_GB
FROM MemCTE
UNION ALL
SELECT 'system_memory_state_desc', CAST(system_memory_state_desc AS sql_variant)
FROM MemCTE

INSERT INTO @Memory (MemItem, MemValue)
SELECT REPLACE(name, 'server memory (MB)', 'allowed SQL server memory (GB)'),
       CAST(CAST(value_in_use AS bigint)/1024. AS numeric(15, 2))
FROM sys.configurations
WHERE name IN ('min server memory (MB)', 'max server memory (MB)')

INSERT INTO @Memory (MemItem, MemValue)
SELECT 'Buffer Pool Size (GB)',
       CAST((COUNT_BIG(*) * (8*1024))/1024/1024/1024. AS numeric(15, 2))
FROM sys.dm_os_buffer_descriptors

INSERT INTO @Memory (MemItem, MemValue)
SELECT 'Procedure Cache Size (GB)',
       CAST(SUM(CAST(size_in_bytes AS bigint))/1024/1024/1024. AS numeric(15, 2))
FROM sys.dm_exec_cached_plans

SELECT MemItem, MemValue
FROM @Memory
ORDER BY MemIDPlease note, the query would take a few seconds or half a minute, on SQL Servers running on systems with large memory allocations – that is because, the query gets the buffer pool size data from sys.dm_os_buffer_descriptors, which returns information about all the data pages that are currently in the SQL Server buffer pool.
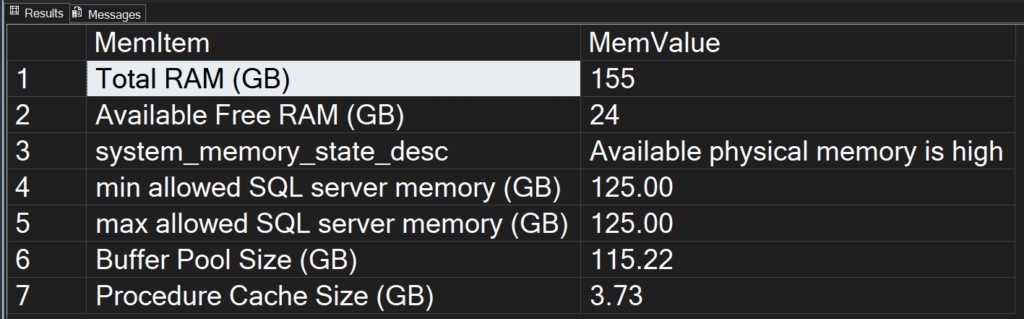
Here’s how the output looks like:
Things to look out for in the output:
- Row #1 shows the total amount of RAM available on the host
- Row #2 shows the amount of unused/free RAM available on your SQL Server. Make sure this is not running too low. As a minimum I would like to see 10%of free RAM on my SQL Servers.
- Row #3 is derived directly from the column system_memory_state_desc from the DMV sys.dm_os_sys_memory. Make sure this is displaying “Available physical memory is high”. Depending on the current memory situation, it would also show messages like ‘Available physical memory is low’ or ‘Available physical memory is steady’.
- Rows #4 and #5 just show you the limits imposed on the buffer pool size via sp_configure.
- Row #6 shows you the size of the current buffer pool, which contains the data that is currently cached in memory by your SQL Server. Higher the value, the better, as it indicates more data is cached. This value would be low on freshly restarted SQL Server instances, and the buffer cache builds up over a period of time.
- Row #7 indicates the current size of procedure cache. Keep an eye on it. If it is too high, it could indicate that there are too many ad hoc plans being cached, which is a waste of memory. Use stored procedures and parameterised queries where possible. Use “Optimize for Ad Hoc Workloads” server configuration option to reduce the bloating of plan cache.
If you can think of any other additions to this query that would make it more useful, please share by leaving a comment.
