


When it comes to checking how well the disks are performing on your SQL Server, sys.dm_io_virtual_file_stats is your best friend. This Dynamic Management View (DMV) returns I/O statistics for data and log files in an easily understandable manner.
Using the information from sys.dm_io_virtual_file_stats you can derive so a lot of useful information like:
- Number of reads
- Number of writes
- Total amount of data read
- Total amount of data written
- Average time taken per read (milliseconds)
- Average time taken per write (milliseconds)
- Average read size
- Average write size
The key things to look out for are the read and write disk response times in milliseconds and the amount of data being read and written to. Ideally you would want to have the average read and write performance times under 10 milliseconds (closer to 0 the better).
Also, if you see huge amounts of data being read, that very likely indicates huge tables are being scanned. Table scans and index scans result in large amount of disk reads. Tune your queries and indexes to convert the scans to index seeks. This reduces the disk reads.
It is important to note the contents of this sys.dm_io_virtual_file_stats get reset at server restart. The numbers you see are only covering the period since the server restart. The longer the server has been up, the better, as any temporary spikes get evened out over a longer period.
To query this DMV, on SQL Server 2019 and prior versions, you would need VIEW SERVER STATE permission. SQL Server 2022 and later versions require VIEW SERVER PERFORMANCE STATE permission.
sys.dm_io_virtual_file_stats has been aronud since SQL Server 2005, before which it was introduced as sys.fn_virtualfilestats in SQL Server 2000. Clearly, this has been around for a long time. Many websites have written about it too.
In this post, I am going to present my own take on sys.dm_io_virtual_file_stats, with the key focus on making the data more readable and presentable – basically making it easy for users to understand.
Example 1: Disk IO performance stats for all database files on the server:
--Disk I/O Stats for All Database files

-- Script created by Vyas Kondreddi
-- https://dutyDBA.com

SELECT
	DB_NAME(dbf.database_id) AS DBName,
	dbf.physical_name AS [FileName],
	vfs.num_of_reads AS TotalReads,
	CAST(vfs.num_of_bytes_read/1024/1024/1024. AS numeric(10,2)) AS TotalRead_GB,
	vfs.io_stall_read_ms/NULLIF(vfs.num_of_reads, 0) AS AvgWaitPerRead_MS,
	CAST((vfs.num_of_bytes_read/NULLIF(vfs.num_of_reads, 0))/1024. AS numeric(10, 2)) AS AvgReadSize_KB,
	vfs.num_of_writes AS TotalWrites,
	CAST(vfs.num_of_bytes_written/1024/1024/1024. AS numeric(10,2)) AS TotalWritten_GB,
	vfs.io_stall_write_ms/NULLIF(vfs.num_of_writes, 0) AS AvgWaitPerWrite_MS,
	CAST((vfs.num_of_bytes_written/NULLIF(vfs.num_of_writes, 0))/1024. AS numeric(10, 2)) AS AvgWriteSize_KB
FROM
	sys.dm_io_virtual_file_stats(NULL, NULL) AS vfs
	INNER JOIN
	sys.master_files AS dbf
	ON	vfs.database_id = dbf.database_id
		  AND	vfs.[file_id] = dbf.[file_id]
ORDER BY
	DB_NAME(dbf.database_id) ASC,
	dbf.physical_name ASC
GO
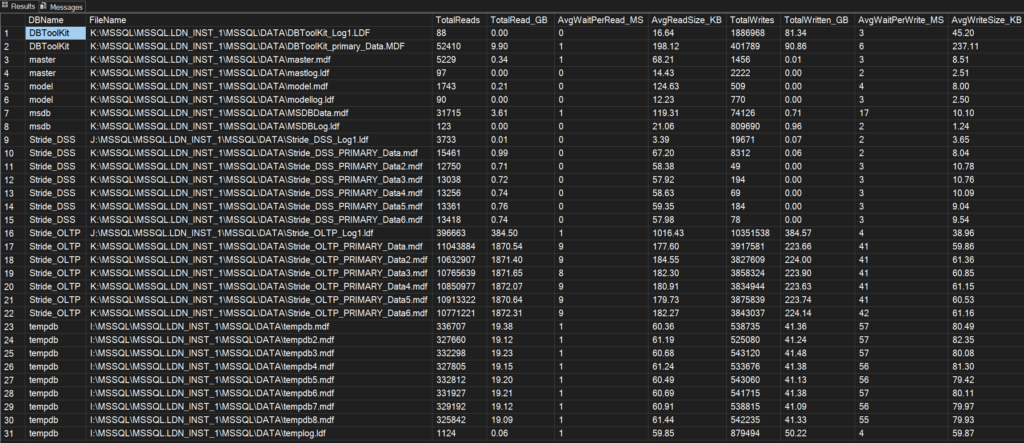
The screenshot below shows the output from one of my servers. This should give you an idea of the sort of information the above query produces:
Example 2: Disk IO performance stats grouped at database level
--Disk I/O Stats grouped by database

-- Script created by Vyas Kondreddi
-- https://dutyDBA.com

SELECT
	DB_NAME(dbf.database_id) AS DBName,
	SUM(vfs.num_of_reads) AS TotalReads,
	CAST(SUM(vfs.num_of_bytes_read/1024/1024/1024.) AS numeric(10, 2)) AS TotalRead_GB,
	AVG(vfs.io_stall_read_ms/NULLIF(vfs.num_of_reads, 0)) AS AvgWaitPerRead_MS,
	CAST(AVG((vfs.num_of_bytes_read/NULLIF(vfs.num_of_reads, 0))/1024.) AS numeric(10, 2)) AS AvgReadSize_KB,
	SUM(vfs.num_of_writes) AS TotalWrites,
	CAST(SUM(vfs.num_of_bytes_written/1024/1024/1024.) AS numeric(10, 2)) AS TotalWritten_GB,
	AVG(vfs.io_stall_write_ms/NULLIF(vfs.num_of_writes, 0)) AS AvgWaitPerWrite_MS,
	CAST(AVG((vfs.num_of_bytes_written/NULLIF(vfs.num_of_writes, 0))/1024.) AS numeric(10, 2)) AS AvgWriteSize_KB
FROM
	sys.dm_io_virtual_file_stats(NULL, NULL) AS vfs
	INNER JOIN
	sys.master_files AS dbf
	ON	vfs.database_id = dbf.database_id
		  AND	vfs.[file_id] = dbf.[file_id]
GROUP BY DB_NAME(dbf.database_id)
ORDER BY
  AVG(vfs.io_stall_read_ms/NULLIF(vfs.num_of_reads, 0)) +
  AVG(vfs.io_stall_write_ms/NULLIF(vfs.num_of_writes, 0)) DESC
GOThis screenshot shows the output of above query. As you can see the IO performnce figures are grouped by database:

Example 3: Disk IO performance stats grouped by drive/disk/mountpoint
--Disk I/O Stats grouped by disk/drive or mount point

-- Script created by Vyas Kondreddi
-- https://dutyDBA.com

SELECT
	LEFT(dbf.physical_name, LEN(dbf.physical_name) - CHARINDEX('\', REVERSE(dbf.physical_name))) AS [Drive/MountPoint],
	SUM(vfs.num_of_reads) AS TotalReads,
	CAST(SUM(vfs.num_of_bytes_read/1024/1024/1024.) AS numeric(10, 2)) AS TotalRead_GB,
	AVG(vfs.io_stall_read_ms/NULLIF(vfs.num_of_reads, 0)) AS AvgWaitPerRead_MS,
	CAST(AVG((vfs.num_of_bytes_read/NULLIF(vfs.num_of_reads, 0))/1024.) AS numeric(10, 2)) AS AvgReadSize_KB,
	SUM(vfs.num_of_writes) AS TotalWrites,
	CAST(SUM(vfs.num_of_bytes_written/1024/1024/1024.) AS numeric(10, 2)) AS TotalWritten_GB,
	AVG(vfs.io_stall_write_ms/NULLIF(vfs.num_of_writes, 0)) AS AvgWaitPerWrite_MS,
	CAST(AVG((vfs.num_of_bytes_written/NULLIF(vfs.num_of_writes, 0))/1024.) AS numeric(10, 2)) AS AvgWriteSize_KB
FROM
	sys.dm_io_virtual_file_stats(NULL, NULL) AS vfs
	INNER JOIN
	sys.master_files AS dbf
	ON	vfs.database_id = dbf.database_id
		  AND	vfs.[file_id] = dbf.[file_id]
GROUP BY LEFT(dbf.physical_name, LEN(dbf.physical_name) - CHARINDEX('\', REVERSE(dbf.physical_name)))
ORDER BY
  AVG(vfs.io_stall_read_ms/NULLIF(vfs.num_of_reads, 0)) +
  AVG(vfs.io_stall_write_ms/NULLIF(vfs.num_of_writes, 0)) DESC
GOScreenshot showing the output of above query, where disk performance figures are grouped by individual disk or mount point where the the database files and transaction log files are stored:

Hope the above code examples gave you a good idea on how to use sys.dm_io_virtual_file_stats to get snapshot of disk performance of your SQL Server drives. Please share your thoughts and any other ideas on how to interpret this DMV, by leaving a comment below.
